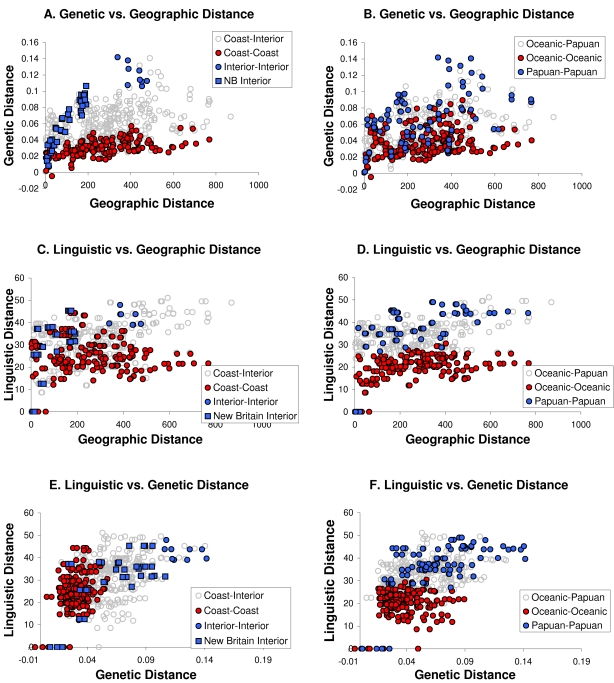
Figure 7. Plots of genetic, linguistic, and geographic distance comparisons.
Coastal vs. coastal (red circles) and interior vs. interior (blue circles) are highlighted in the plots on the left. Blue squares highlight the interior New Britain comparisons. Oceanic vs. Oceanic (red circles) and Papuan vs. Papuan (blue circles) comparisons are highlighted in the plots on the right. (A,B) Genetic vs. geographic distance plots. (C,D) Linguistic vs. geographic distance plots. (E,F) Linguistic vs. genetic distance plots.

