
Figure 2.
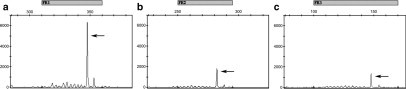
Electropherograms of PCRs for IGH rearrangements. The x axis indicates DNA length in nucleotides with expected product sizes above the axis. The y axis indicates relative fluorescence units. Shown are amplification products from a case of ALK− ALCL. a, b, and c represent different multiplex PCRs that use primers that bind to the FR1 (a), FR2 (b), or FR3 (c) region of IGH. This case was interpreted as positive with clonal peaks (arrows) detected by FR1, FR2, and FR3 primers.