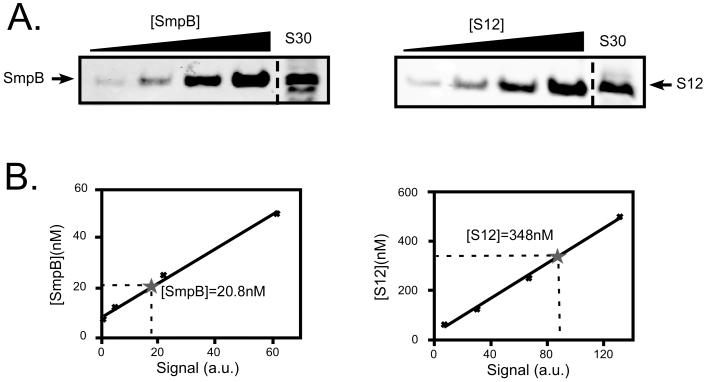
Figure 3. SmpB:ribosome ratio measurements.
Panel A depicts quantitative western blots, measuring the concentrations of SmpB and ribosomal protein S12 in S30 extracts from W3110 cells. S30 extracts, along with titrations of either purified SmpB or purified ribosomal protein S12 were subjected to Western blot analysis with antibodies directed against either SmpB or S12. Panel B shows curve fit of the Western blot signals (in arbitrary units) versus concentration of either SmpB or S12 standards. Asterisks indicate the concentrations of SmpB or S12 in S30. The summary of data from six independent experiments gave an [SmpB]:[S12] ratio of 1:14.2+/-2.4.

