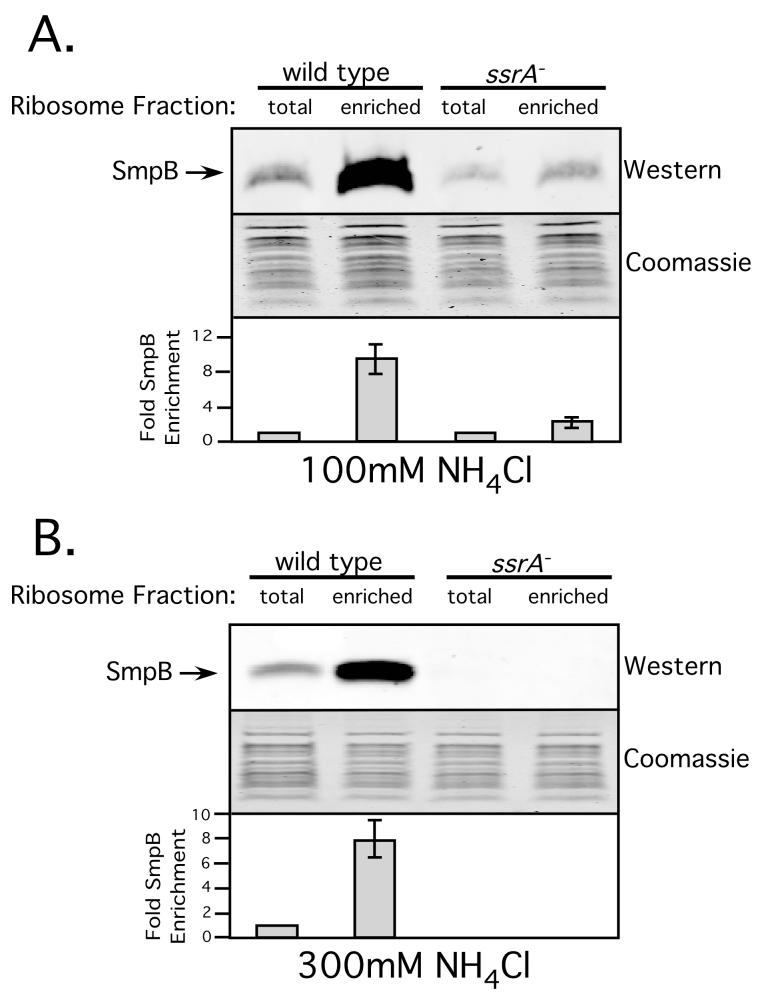
Figure 6. Enrichment of SmpB in ribosomes stalled on a non-stop message.
Quantitative Western Blot analysis of the relative abundance of SmpB in stalled vs. total ribosome fractions. Graph represents mean +/- standard deviation of the relative amount of SmpB bound per ribosome in the stalled ribosome fraction vs. total ribosomes.

