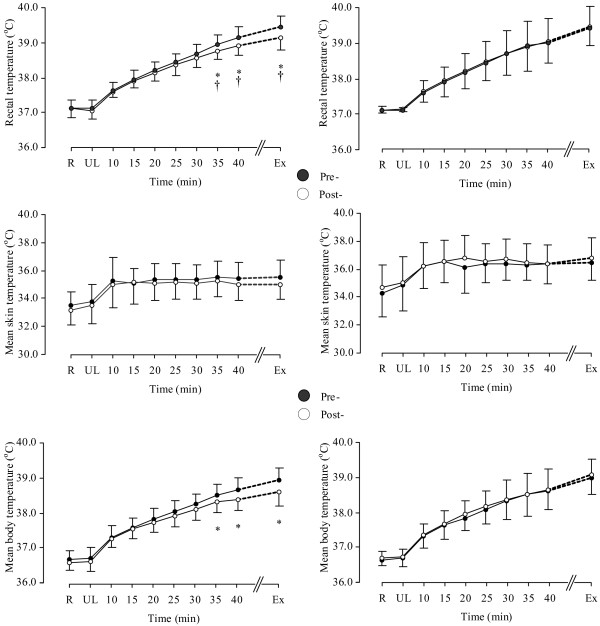
Figure 1.
Rectal temperature (top panel), mean skin temperature (middle panel) and mean body temperature (bottom panel) in the Cr (left side) and placebo (right side) supplemented groups. *: indicates a significant difference between pre (●) to post (○) supplementation. †: indicates a significant greater change in the Cr group compared with the placebo group (p < 0.05). Values are given as mean (SD).

