Figure 3.
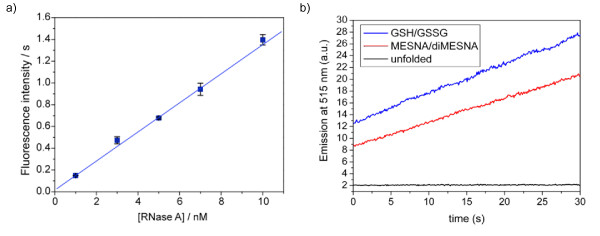
Efficiency of the MESNA/diMESNA refolding buffer. a) Calibration curve of the relation between initial enzyme activity and enzyme concentration. Error bars represent one standard deviation based on duplo experiments. All enzymatic activity measurements were performed in 0.1 M TRIS, 0.1 M NaCl, pH 8 buffer at 10°C with a substrate concentration of 400 nM. b) Enzyme activity of 5 nM unfolded RNase A and of 5 nM RNase A after refolding in either glutathione or MESNA refolding buffer (0.1 M Tris, 0.1 M NaCl, 3 mM reduced, 1 mM oxidized reagent; pH 8.0; 20°C, o/n); RNase A concentrations were calculated by comparison of the obtained initial velocity (from a linear fit to the first 30 seconds of the activity assay) to the calibration curve depicted in a).

