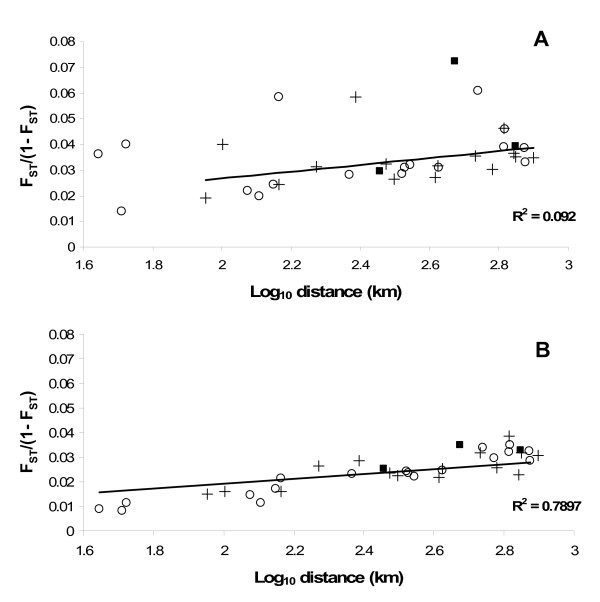
Figure 5.
Geographic versus genetic distance. Relationship between genetic distance and geographic distance. Genetic distance was calculated from the mean FST for each pair of populations with (A) and without (B) outlier loci. Circles represent a pairwise comparison of a Superfund versus a reference site, squares represent a Superfund versus a Superfund site comparison, and crosses represent a reference versus a reference site comparison.

