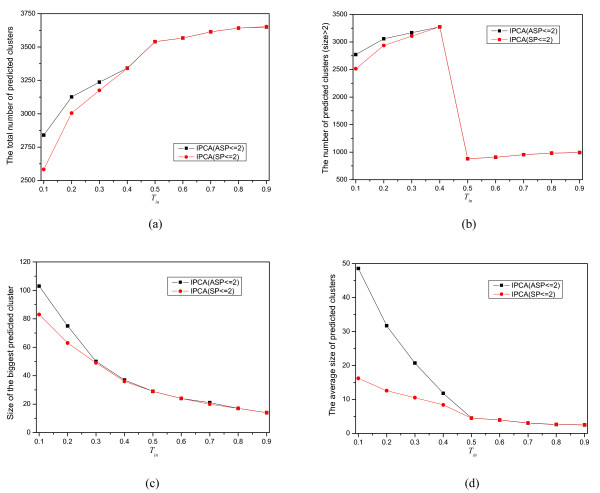
Figure 3.
The effect of Tin on clustering. Nine sets are generated from the yeast network by IPCA using SP ≤ 2 and Tin = 0.1, 0.2,...,0.9, and nine sets are generated by IPCA using ASP ≤ 2 and Tin = 0.1, 0.2,...,0.9. (a) the total number of predicted clusters, (b) the number of the predicted clusters with size > 2, (c)size of the biggest predicted cluster, (d) The average size of the predicted clusters.

