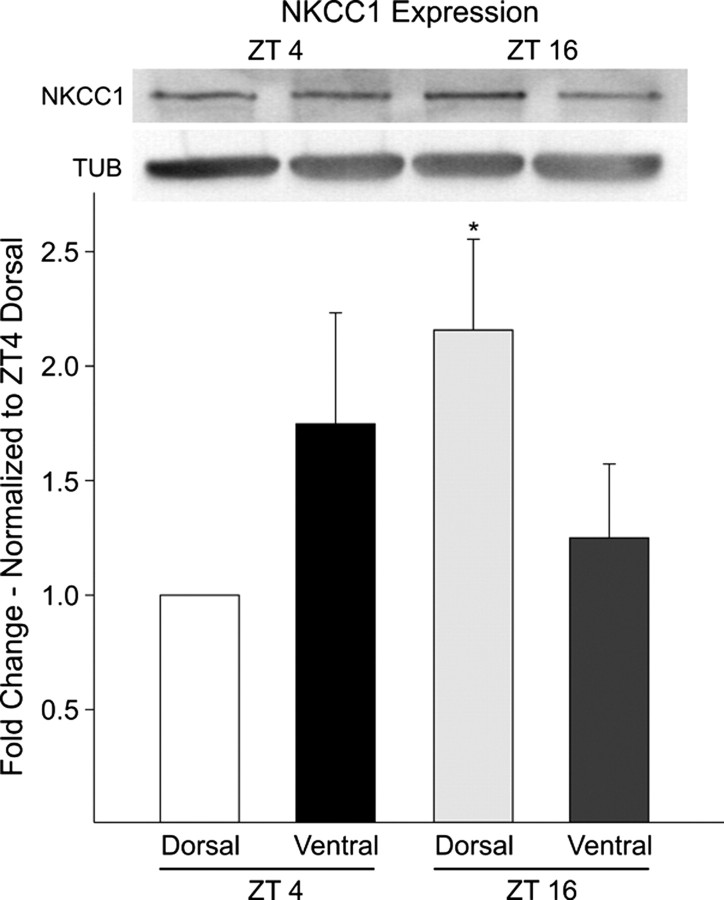
Figure 8.
Western blot analysis of NKCC1 proteins from the dorsal and ventral regions of the mouse SCN taken at day (ZT 4) and night (ZT 16). Bottom, Histogram illustrating results from three independent experiments. NKCC1 levels were significantly (p < 0.05) higher in the night (ZT 16) in the dorsal region. In contrast, protein expression in the ventral region did not fluctuate. For each experiment, the values were normalized to samples collected from the dorsal SCN at ZT 4. Top, Anti-NKCC1 antibody recognized a high molecular weight band of ∼160 kDa in size. NKCC1 levels were normalized to tubulin to control for loading. Error bars indicate SEM.

