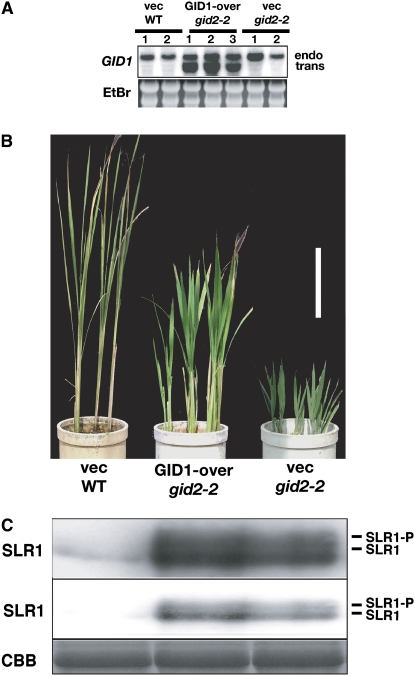
Figure 5.
Enhanced Accumulation of SLR1 Protein in gid2 Plants Overproducing GID1.
(A) Top panel: RNA gel blot analysis of the endogenous and transformed GID1 transcripts. vec WT, wild type transformed with the empty pActNos vector; GID1-over gid2-2, gid2-2 plant transformed with the GID1 overproducing construct; vec gid2-2, gid2-2 plant transformed with the empty vector; endo, the GID1 transcript derived from the endogenous GID1 gene; trans, the GID1 transcript derived from the introduced GID1 gene. Bottom panel: Ethidium bromide (EtBr) staining to show equal loading.
(B) Gross morphology of transgenic seedlings grown for 2 months after regeneration. Bar = 10 cm.
(C) Protein gel blot showing the level of SLR1 protein in the seedlings shown in (B). Approximately 10 μg (top panel) and 2 μg (middle panel) of total protein was loaded in each lane. SLR1-P, phosphorylated SLR1; SLR1, non-phosphorylated SLR1. Bottom panel, Coomassie blue (CBB) staining of the blot from the top panel to show that approximately equal amounts of total protein (10 μg) were loaded in each lane.

