
Figure 4.
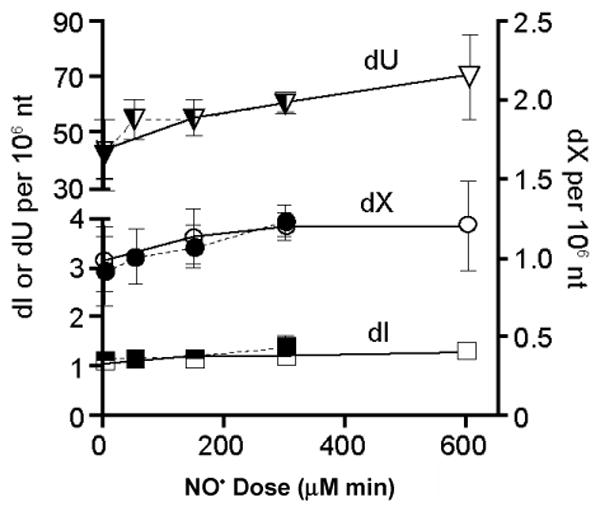
Formation of dU, dX, and dI in DNA of TK6 (solid) and NH32 (open) cells exposed to NO• at the sublethal, threshold and toxic doses (50, 150 and 300 μM min for TK6 cells; 150, 300 and 600 μM min for NH32 cells), respectively. The only statistically significant increase in a DNA deamination product over control occurred with dU in NH32 cells treated with 600 μM min NO• (p <0..05). Data represent the mean ± SD for N = 4.