
Figure 6.
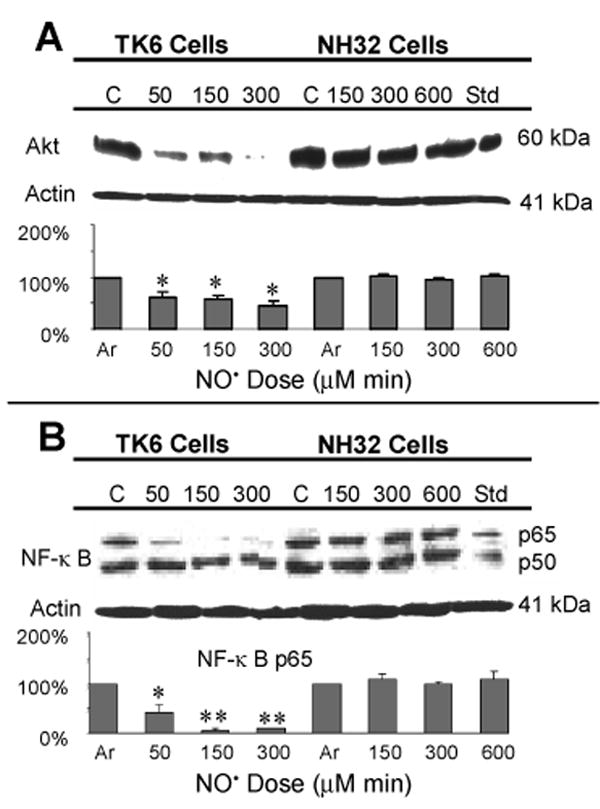
Immunoblot analysis of Akt and NF-κB p50 and p65 proteins in TK6 and NH32 cells following various doses of NO• treatment. Jurkat cells treated with 4 μM staurosporine were used as positive controls and densitometric analyses were as indicated in Figure 5. Values are mean quantitative densitometric values and 95% confidence intervals from two to three independent experiments. * p < 0.05 and ** p < 0.01, compared with argon-treated controls. Changes in levels of NF-κB p50 protein were not statistically significant (p > 0.05) and the densitometric values not shown.