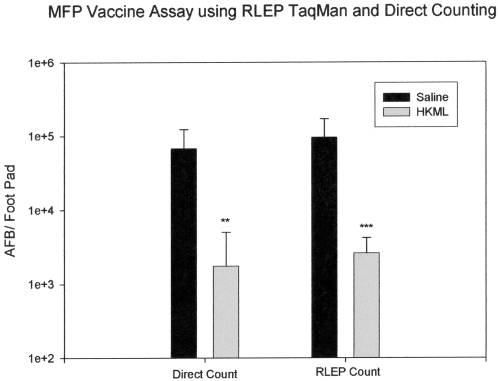
Figure 3. A comparison of RLEP TaqMan PCR and M. leprae counting results from a vaccine trial using conventional C57/B mice.
Bars represent mean plus the standard deviation for each group. ** = probability of statistical significance (p)<0.01, and *** = probability of statistical significance (p)<0.001.

