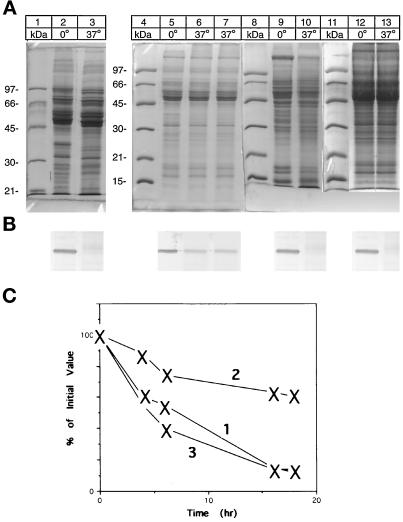
Figure 4.
Selective degradation of desaturase in subcellular fractions. Aliquots of the various subcellular fractions (10–15 μg) were incubated overnight at 0 and 37°C in 50 μl of 50 mM Tris-acetate, pH 7.9 containing 50 mM KCl. Before SDS-PAGE, 75 μl of gel loading buffer were added, and a 10-μl aliquot was loaded to each lane of duplicate gels. (A) Coomassie Blue-stained gels; (B) Western Blot of the above gels with antidesaturase antibody. Lanes 2 and 3, pyrophosphate-washed microsomes; lanes 5 and 6, high-salt–washed microsomes; lane 7, high-salt–washed microsomes supplemented with ATP (2 mM) and Mg2+ (5 mM). Lanes 9 and 10, P-1 fraction incubated at 0 and 37°C; lanes 12 and 13, high-salt–washed microsomes supplemented with P-1 fraction and incubated at 0 and 37°C. (C) Estimated time course of the degradation of the desaturase. Aliquots of the various subcellular fractions were incubated at 37°C and control fractions at −20°C for the indicated time and interacted with desaturase antibody. Curve 1, desaturase-induced microsomes. Curve 2, high-salt–washed microsomes or high-salt–washed microsomes supplemented with ATP. Curve 3, high-salt– washed microsomes supplemented with P-1 fraction. The amount of desaturase was determined by densitometry and is expressed as a percentage of the amount present at the start of the experiment, which is set to 100%.

