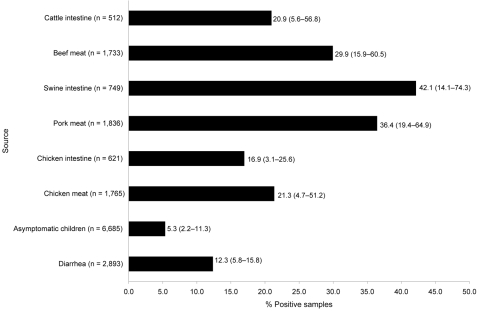
Figure 1.
Percentage of human, retail meat, and food-animal samples positive for Salmonella spp. detected by an integrated food chain system in Mexico, 2002–2005. Numbers to the right of bars indicate average values, and numbers in parentheses indicate the frequency of positive samples in the states with the lowest and highest prevalence, respectively. The number of specimens examined from each source (n) is shown next to each source heading.

