An official website of the United States government
Here's how you know
Official websites use .gov
A
.gov website belongs to an official
government organization in the United States.
Secure .gov websites use HTTPS
A lock (
) or https:// means you've safely
connected to the .gov website. Share sensitive
information only on official, secure websites.

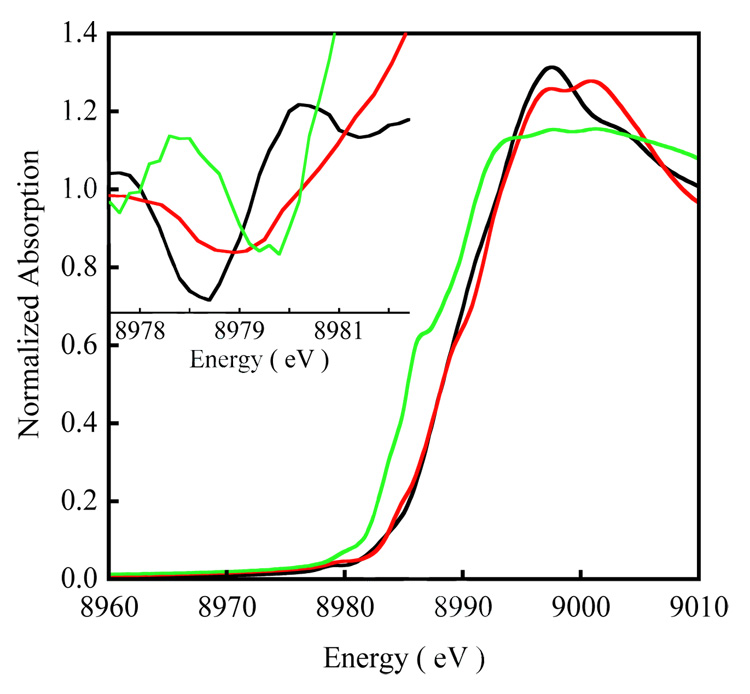
 ), 2 (
 ) and 3 (
 ). Inset shows the expanded pre-edge region of the second derivative spectrum of the 1s→3d transition at ~8979 eV.