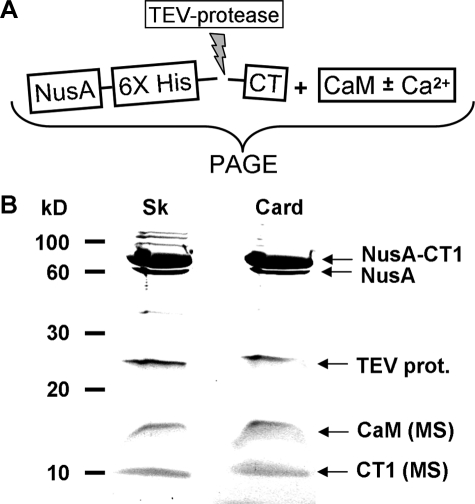
FIGURE 2.
A, scheme used to generate reaction mixtures of CaM and C-terminal (CT) fragments of CaV1.1 (Sk) or CaV1.2 (Card). B, Coomassie-stained SDS-PAGE of the reaction mixtures confirms that both skeletal and cardiac CT fragments (see Fig. 1) were expressed and released from the NusA fusion by the TEV-protease treatment. CT1 is shown here as an example. Mass spectrometric analysis (MS) of the low molecular mass bands identified CaM (16.7 kDa) and either the skeletal or cardiac CT1 (both 11.3 kDa). Note that digestion with TEV-protease was not run to completeness in this example, as is indicated by the presence of two bands in the 60–80 kDa range.

