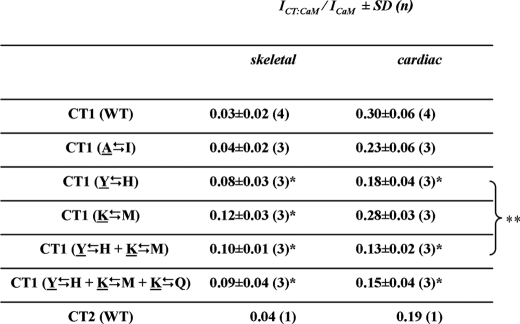
TABLE 1.
Densitometric analysis of the binding of CT constructs to CaM in the presence of 2 mm Ca2+ Values give the ratio between the band intensity of the CT-CaM complex (ICT:CaM) and the intensity of the corresponding band (in the same lane) of free CaM (ICaM), as determined by densitometry. In the left column indicating mutational exchanges within the CT constructs, native cardiac residues are underlined. The values listed under the skeletal column for CT1 (WT), CT1 (I → A), and CT2 (WT) likely represent nonspecific smearing rather than presence of a CT·CaM complex since comparable values were obtained by densitometric integration of regions above or below the region of expected complex formation.
Significantly different (p < 0.05) from CT1 (WT)
Not significantly different (p = 0.12)

