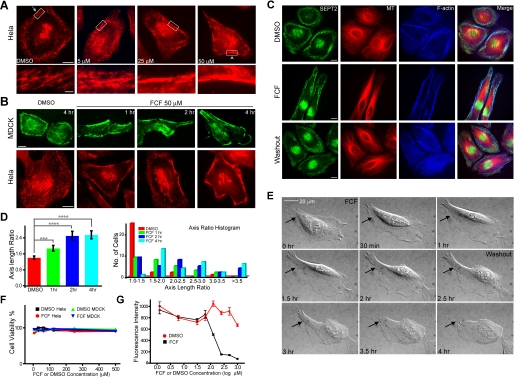
FIGURE 2.
FCF reversibly alters septin organization in HeLa and MDCK cells. A, immunofluorescence images of HeLa cells stained for SEPT2 after treatment with 5, 25, or 50 μm FCF or DMSO for 2 h; scale bars, 10 μm. Lower panels show the boxed regions at higher magnification; scale bar, 2 μm. B, MDCK and HeLa cells were treated with DMSO for 4 h or FCF for 1,2, or 4 h and stained for SEPT2; scale bars, 10 μm. C, immunofluorescence images of HeLa cells stained for SEPT2 (green),α-tubulin (red), and F-actin (blue) after treatment with DMSO for 4 h (top panel) or 50 μm FCF for 4 h (middle panel) followed by a 2-h washout with regular cell medium (bottom panel); scale bars, 10 μm. D, the bar graph (left panel) shows ratios (mean ± S.E.) of lengths of major cell axes to lengths of minor cell axes for MDCK cells treated with DMSO (red) or 50 μm FCF for 1 (green), 2 (blue), and 4 h (cyan); ***, p = 0.0049; ****, p < 0.0001. The histogram (right panel) shows the distribution of axis ratio values after DMSO and FCF treatments. E, differential interference contrast images from time-lapse microscopy (supplemental movies 1 and 2) of HeLa cells. FCF was added at 0 h and washed out at 2.5 h. Arrows point to a cell region that becomes elongated during FCF treatment and retracts upon FCF washout. F, a trypan blue cytotoxicity assay of HeLa or MDCK cells treated with various concentrations of DMSO or FCF (6.25-500 μm) for 4 h. Trypsinized cells were stained with trypan blue reagent and counted as the percentage of total cells (n =∼200). G, an alamarBlue cytotoxicity assay of HeLa cells treated with various concentrations of DMSO (red circles) or FCF (1.25 μm-1 mm; black squares) for 24 h. Cell medium was incubated with alamarBlue reagent, and fluorescence intensities (mean ± S.E.) were plotted as a function of time. All measurements were performed in quadruplicates.

