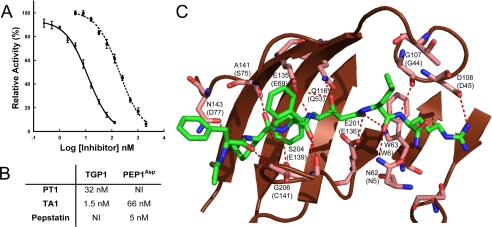
FIGURE 5.
A, determination of IC50 for PT1 (broken line) and TA1 (solid line) for TGP1. B, comparison of Ki values for inhibitors of TGP1 and PEP1Asp. NI = no inhibition at 10 μm. C, homology model of TGP1 with SGP (2IFW) containing TA1. TGP1 residues within 10 Å of TA1 (green stick model) are highlighted, and predicted hydrogen bonding interactions between the enzyme and inhibitor are indicated (broken red line). Residues that are structurally equivalent in SGP are indicated in parentheses.

