TABLE 2.
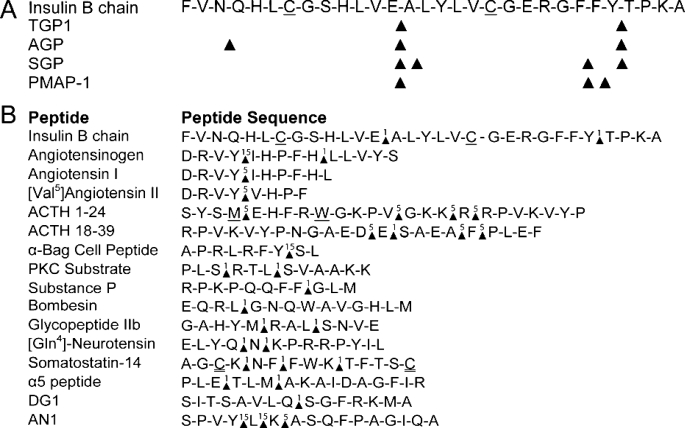
A, comparison of insulin B chain cleavage sites by glutamic peptidases; B, hydrolysis of a diverse peptide library by TGPI A, cleavage sites are indicated by a triangle. B, time in minutes that digestion products are first observed are indicated above the triangle. Oxidized and iodoacetylated amino acids are underlined and double underlined, respectively.

