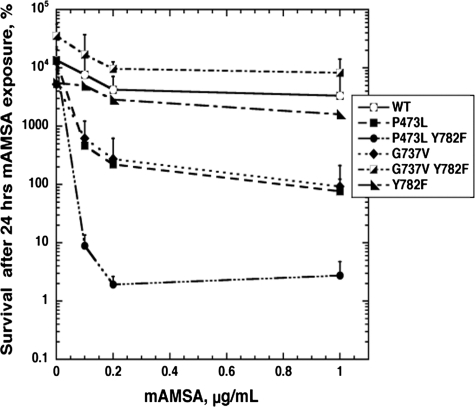
FIGURE 11.
mAMSA sensitivity conferred by single strand DNA cleavage. JN394 (rad52- and TOP2+) yeast cells carried pDED1Top2 with genotypes as indicated on the figure. WT, pDED1Top2 with no mutations; the others were pDED1Top2 with the indicated amino acid changes. As in the experiment shown in Fig. 1, aliquots were removed after 24-h drug exposure, and samples were then diluted and plated to complete synthetic medium plates lacking uracil. Cell survival is expressed as the percentage of surviving cells at the time 24 h relative to the viable titer at the time drug was added (t = 0). Error bars represent the standard deviation of three independent experiments. Note that the mAMSA concentrations shown here are much less than shown in Fig. 1.

