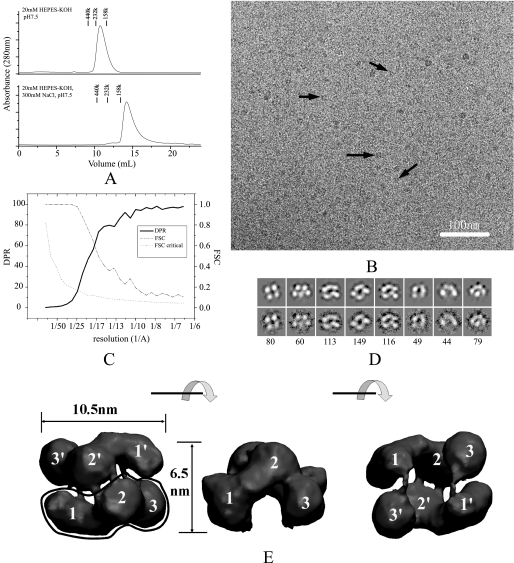
FIGURE 1.
The E. coli SecA structure in solution. A, size-exclusion chromatography of SecA at 4 °C. A 125-μg sample of SecA was injected to a Superdex 200 column and eluted in a buffer of 20 mm HEPES-KOH, pH 7.5, or 20 mm HEPES-KOH, 300 mm KCl, pH 7.5. Marker proteins are: Ferritin (440 kDa), bovine catalase (232 kDa), and aldolase (158 kDa). B, cryo-EM image of 100 μg/ml SecA in buffer (20 mm Tris-Ac, pH 7.5, 1 mm DTT). Some individual particles are indicated by black arrows. The bar is 100 nm. C, resolution curves of the three-dimensional reconstruction. The resolutions calculated from two methods are shown: Fourier shell correlation (FSC) function (dashed line) and differential phase residual (DPR) function (solid line). The dotted line is the critical Fourier shell correlation function 3δ. D, distinct views of SecA cryo-EM samples. The top panel is the projection map of the reconstructed model; the bottom panel is the average map of all particles in this class; the number of particles in this class is indicated in the bottom panel. The box is 18.4 nm. E, surface representation of the three-dimensional reconstruction. The surface was rendered and displayed using the VMD software. Three views are shown: top view, side view, and bottom view. Each view was obtained after 90° rotation around the horizontal axis, as shown between the views. The three domains in the two subunits are designated as 1, 2, and 3, and 1′, 2′, and 3′.

