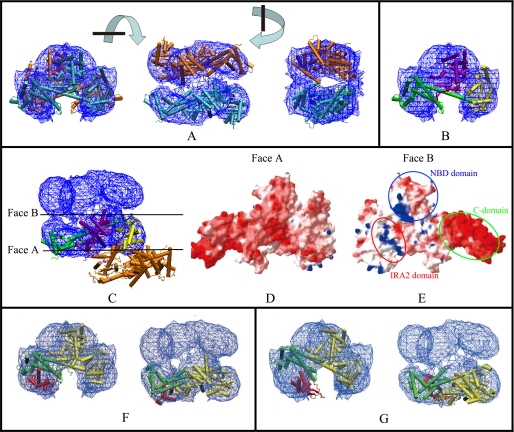
FIGURE 2.
Docking of the cryo-EM three-dimensional map with the ecSecA crystal structure and comparison of the structures from cryo-EM and X-rays. A, chain A in the ecSecA (PDB number: 2FSF) was used for docking. The blue mesh represents the 1.5 σ contour of the electron density map. There are two molecules in the cryo-EM map, colored cyan and orange. Three views are shown. Each view is obtained after 90° rotation around the perpendicular or horizontal axis, as shown between the views. B, the docked crystal structure is rendered in different colors for different domains. For clarity, only one SecA protomer is shown. Similar to the assignment by Papanikolau et al. (19), ecSecA is divided into four parts: the NBD domain (purple); the Var, IRA2, and joint domains (yellow); the PBD domain (red); the C-terminal 30-kDa domain comprised of the IRA1, WD, SD, and CTD subdomains (green). As noted above, only a small fraction of PBD structure is seen in the refined x-ray structure. C, manual docking of one protomer (in different domain colors) in the x-ray dimeric structure (PDB number: 2FSF) into the electron density map. The colors in different domains were assigned as in B. The other protomer (orange) is obviously displaced in the EM map. The two side surfaces of the SecA protomer are designated Face A and Face B. D, view of Face A of the SecA protomer after electrostatic surface calculation. Electrostatic potential is represented as a tricolor gradient from blue (+1.8 kT (k, the constant of boltzmann; T, Thermodynamic temperature)) through white (neutral) to red (–5.8 kT), as represented using the Swiss-PDBviewer and calculated by DELPHY. E, view of Face B of the SecA protomer after electrostatic surface calculation. The patches of the C-domain, the IRA2 domain, and the NBD domain are indicated. The two protomers interact with each other through this interface. F and G, docking of the cryo-EM map with bsSecA x-ray structure in the closed (PDB number: 1M6N) (F) or open (PDB number: 1TF5) (G) state. For clarity, only one SecA protomer is shown. The PBD domain is red, and the C-domain is green. Both the side and the top view are shown.

