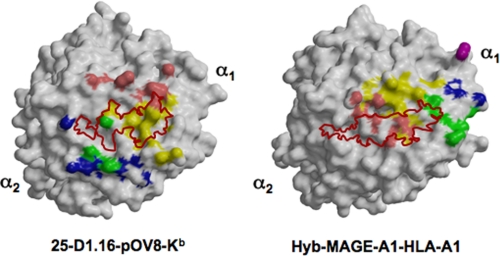
FIGURE 3.
Footprints of 25-D1.16 and Hyb3 CDRs. The left panel shows the contact surfaces of pOV8-Kb, and the right panel shows MAGE-A1-HLA-A1. Direct CDR contacts (colored as described in the legend to Fig. 1A) show the inverted positions of the CDR loops relative to the corresponding pMHC molecules for the two antibodies. The corresponding peptide surfaces are outline in red.

