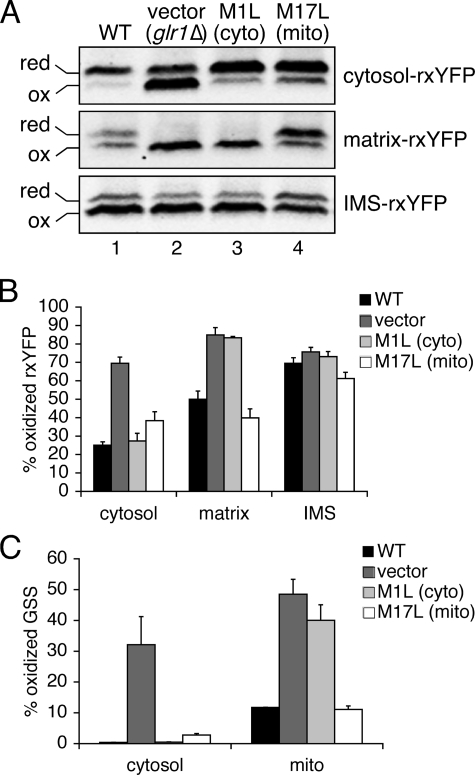
FIGURE 6.
Cytosolic and mitochondrial GSH:GSSG pools are maintained separately. The glr1Δ strain was doubly transformed with an rxYFP expression plasmid (pJH208 (cytosol-rxYFP), pLD207 (matrix-rxYFP), or pJH200 (IMS-rxYFP)) and a Glr1 expression plasmid (pJH201 (WT Glr1), pRS413 (vector control), pJH203 (M1L Glr1), or pJH202 (M17L Glr1)). Cells were grown to mid-log phase in selecting SC glucose media. A, redox Western blot and quantification (B) were performed as described in Fig. 4. C, the percent of oxidized glutathione (percent GSS/(GSH + GSS)) was calculated from total GSH and GSSG levels in each extract. GSS = 2XGSSG. For B and C, the reported values are the mean of three independent experiments. Error bars are the means ± S.D.

