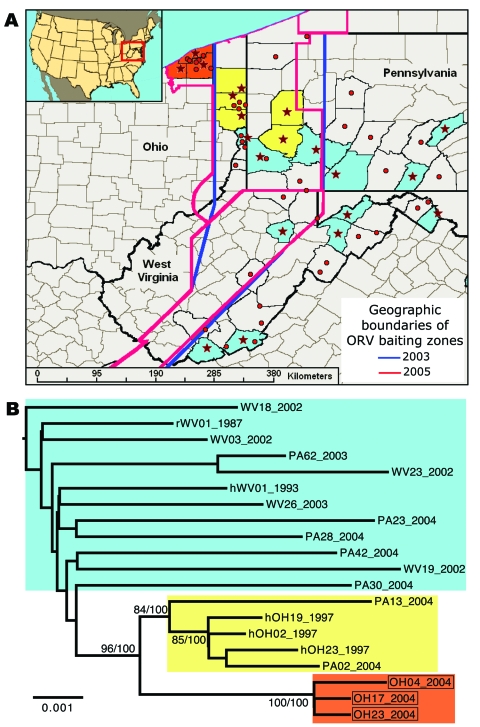
Figure 2.
Spatial and genetic distribution of sequences of the raccoon rabies virus variant (RRV) from the 2004 Ohio outbreak relative to virus found in neighboring areas. A) Distribution of RRV samples included in phylogenetic analysis of G and N gene sequences (stars) or G sequences only (circles). Colors reflect phylogenetic groups as shown in panel B. B) Maximum-likelihood tree of concatenated G and N gene sequences of RRV sampled in or near Ohio, 1987–2004. Samples from the 2004 outbreak are boxed. Bootstrap values and corresponding Bayesian posterior values (% for both) are shown for key nodes. Tree was rooted by using RRV G and N sequences from a Florida raccoon (not shown). ORV, oral rabies vaccine. Scale bar = nucleotide substitutions per site.

