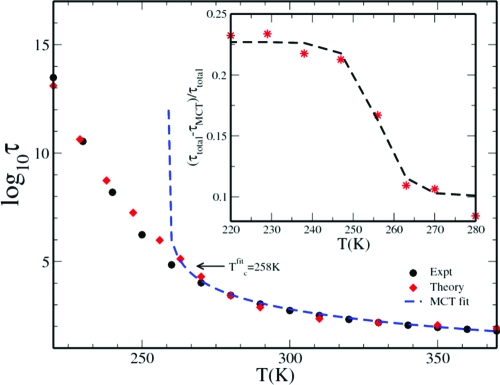
Fig. 1.
Temperature dependence of the α relaxation timescale for Salol–hopping-induced diffusive dynamics. The timescale for the longtime part of the total structural relaxation, ø(t), obtained from experiments (8) (black circles) and that calculated from the present coupled theory, τtotal (red diamonds) are plotted against temperature. We fit the τtotal to the MCT phenomenological expression, τtotal ∼ [(T−Tcfit/Tcfit]−γ (blue dashed line), we obtain Tcfit = 258 K. (Inset) We plot (τMCT−τtotal)/τtotal as obtained from the theory (red stars). The black dashed line is a guide to the eye. The function shows a jump at approximately T = 258 K. We find that across this temperature the hopping dynamics changes its role and below Tcfit = 258 K it plays a direct role in the dynamics. The scaling times is 1 ps.

