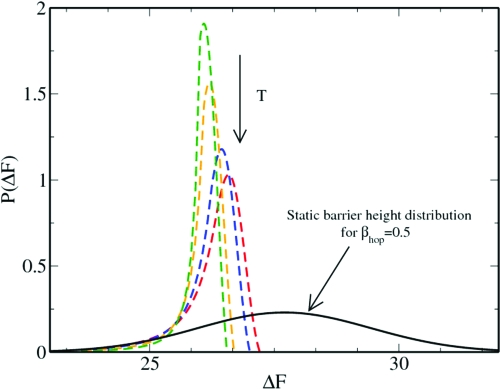
Fig. 3.
Temperature dependence of the probability distribution of barrier heights which participate in the dynamics, ℘dynamics(ΔF). In this figure we plot the static barrier height distribution, ℘static(ΔF), which is used in the calculation of the total dynamics (black solid curve). From the total dynamics we again estimate the barrier height distribution that actually participates in the dynamics (colored dashed line). This has been done for different MCT relaxation time scale by changing the temperature of the MCT part of the dynamics (T = 240 K, 230 K, 200 K, and 175 K). As the temperature is lowered, the barrier height distribution becomes broader.

