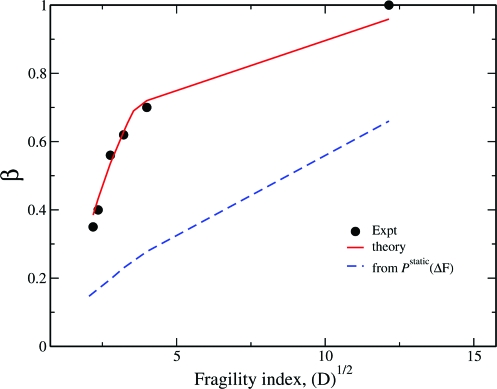
Fig. 4.
Fragility dependence of the stretching parameter. The stretching parameter for the total structural relaxation, ø(t), obtained from experiments βexpt (3) (black circles) and that calculated from the present coupled theory, βtotal (red solid line) are plotted against the square root of fragility index D. As D decreases, the fragility of the system increases. In the same plot we also present the stretching parameter predicted by the full static barrier height distribution (blue dashed line). The experimental and the theoretical values are at the glass transition temperature T = Tg.

