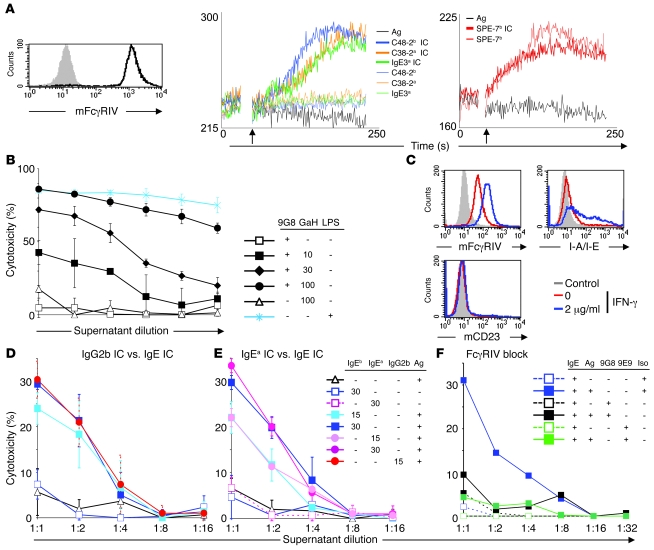
Figure 4. mFcγRIV engagement by IgE ICs induces cell activation in transformed cells.
(A) The histogram represents the binding of 9G8 to mFcγRIV+ DT40. Transfectants were loaded with Fluo-3, and the intracellular Ca2+ concentration was monitored, following triggering (arrows) by Ag alone (black line), IgE alone (thin lines), or IgE ICs (thick lines). Curves represent the relative intracellular Ca2+ concentration as a function of time. Two different lots of SPE-7 were assayed and gave similar results. (B) TNF-α secreted by MH-S cells, induced by LPS or by 1 μg/ml 9G8 and the indicated concentrations (μg/ml) of goat anti-hamster F(ab′)2 (GaH), was titrated in supernatants. (C) Histograms represent the binding of indicated mAbs on IFNγ-treated or untreated MH-S cells. Solid gray histograms represent the binding of isotype controls. (D and E) TNF-α secreted by IFNγ-treated 2.4G2 F(ab′)2–saturated MH-S cells, induced by the following reagents, was titrated in supernatants: (D) IgG2b ICs (Gork) or IgEb ICs (C48-2b) and (E) IgEa ICs (C38-2a) or IgEb ICs (C48-2b). (F) IFNγ-treated MH-S cells were saturated with both 2.4G2 F(ab′)2 and Polymyxin B–treated 9G8, 9E9, or irrelevant hamster IgG (Iso.). TNF-α secreted by these cells induced by IgEb ICs (C48-2b) was titrated in supernatants. Curves represent the percentage of cytotoxicity as a function of MH-S supernatant dilution. All Ig concentrations are indicated in μg/ml. Data are representative of 3 (A–C) or 2 (D–F) experiments. Mean ± SD of triplicates in TNF-α bioassays are represented (B, D, and E).

