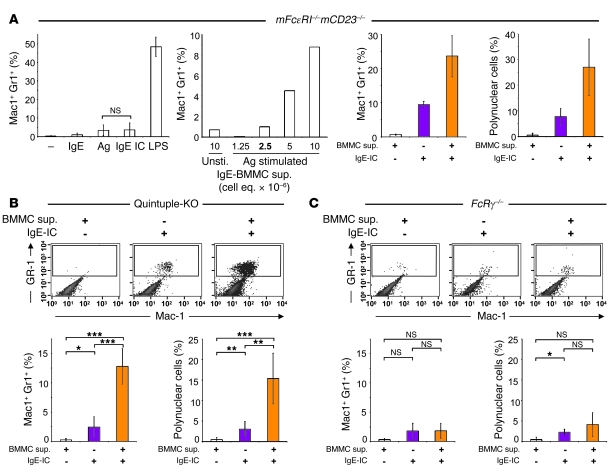
Figure 7. mFcγRIV engagement by IgE ICs in vivo promotes lung infiltration.
(A) mFcεRI–/–mCD23–/– mice were instilled i.n. with IgEa anti-OVA (2C6a), Ag (OVA), preformed IgEa ICs (2C6a-OVA) (n = 7), or LPS (n = 2) (first panel), or with cell-free supernatants corresponding to indicated numbers of unstimulated (Unsti.) or activated WT BMMCs (cell equivalent [eq.] × 10–6) (n = 2) (second panel) on day 0. Bold is used to indicate the dose used in B and C. mFcεRI–/–mCD23–/– mice were instilled i.n. with the same cell-free supernatants (sup.) corresponding to 2.5 × 10⁶ activated BMMCs on day 0 (a dose that does not induce a significant infiltration [1%] compared with that induced by supernatant from unstimulated BMMCs) and with preformed IgEa ICs on day 1 as indicated. Bar graphs represent the percentage of Mac1+ Gr1+ in BAL from these mice 24 hours after i.n. instillation (3 left panels) or the percentage of polynuclear cells in cytospins of BAL (right panel) on day 3. (B and C) Quintuple-KO (n = 5) or FcRγ–/– (n = 3) mice were instilled i.n. with the same cell-free supernatants as in A, corresponding to 2.5 × 10⁶ activated BMMCs on day 0, and with preformed IgEa ICs (2C6a-OVA) on day 1. A representative density plot of BAL cells from these mice on day 2 for each experimental condition is shown. Bar graphs represent the percentage of Mac1+ Gr1+ in BAL or the percentage of polynuclear cells in cytospins of BAL. Error bars represent mean ± SD (A–C) and significant differences between sample means are indicated (***P < 0.001; **P ≤ 0.01; *P < 0.05; n.s., P > 0.05; Student’s t test).

