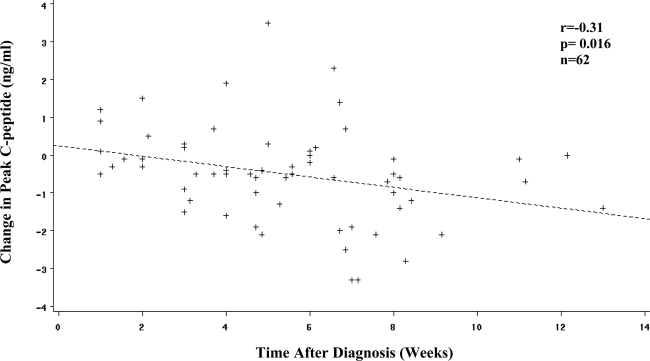
Figure 2.
Association between change in peak C-peptide and time after diagnosis. Shown is the scatter plot for the association between the change in peak C-peptide levels and the time after diagnosis. The amount of decline becomes more substantial with increasing time after diagnosis. (An outlier was removed with a change in peak C-peptide of −8.8 ng/ml and a time after diagnosis of 8.0 weeks [r = −0.31, P = 0.014 with the outlier included.]) When an allowance was made for the peak C-peptide at the first diabetic OGTT, the slope for the difference in peak C-peptide versus time after diagnosis was −0.56 ng · ml−1 · month−1.

