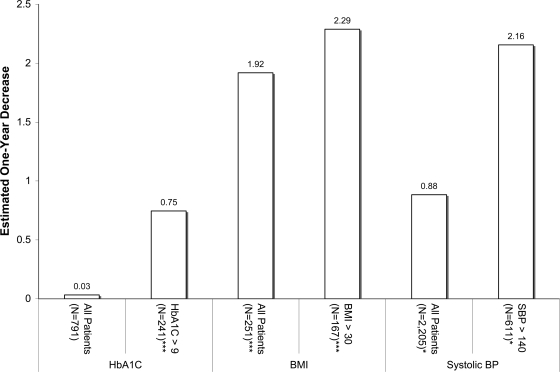
Figure 2.
Summary of trends in clinical measures among CareSouth patients, adjusted for demographics, comorbidities, and patient level clustering. *P <0.05; **P <0.01; ***P <0.0001. Patients with two, three, or four (or more) observations of BMI were 28, 12, and 27, respectively. Comparable numbers for A1C were 35, 28, and 108 and for SPB 11, 15, and 167.

