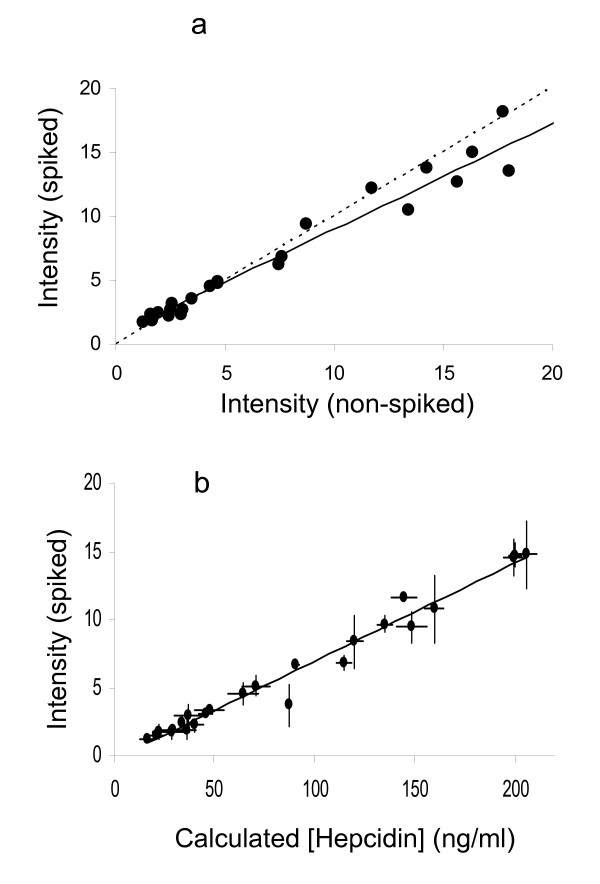
Figure 8.
Comparison of hepcidin concentration and SELDI peak height. Two independent SELDI analyses of 24 serum samples are shown in Figure 8a. SELDI was performed in triplicate following spiking with 200 ng/ml labelled hepcidin and compared with SELDI without spiking (performed in duplicate). Symbols denote the means of experimental replicates, the least-squares linear regression (R2 = 0.827) is shown as a solid line and the ideal 1:1 relationship as a dashed line. Figure 8b shows the relationship between endogenous hepcidin peak height and concentration determined from the peak height ratio in the spiked experiment. Symbols denote mean (± SEM) of experimental triplicates and the trend line least-squares linear regression (R2 = 0.975).

