
Figure 1.
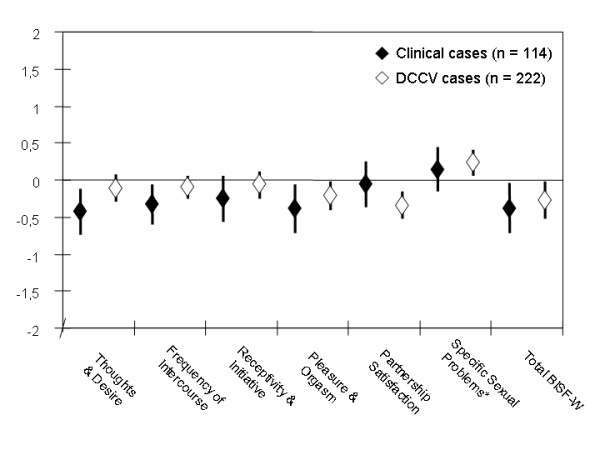
BISF-W scores (z-values) by case group, women with partners only. 0: standard population mean, +/- 1 = +/- 1 standard deviation from standard population mean. *specific problems: higher value = more problems, other scores: higher value = better function.