
Figure 4.
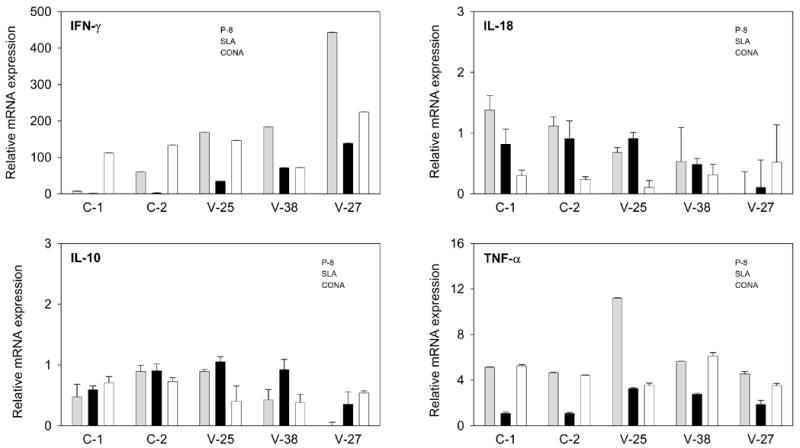
Cytokine gene expression in PBMC from asymptomatic L. infantum infected dogs and healthy control dogs (Group 2) after stimulation with P-8 antigen from L. pifanoi. QRT-PCR data were analysed by using the 2−ΔΔCt method. Differences in gene transcription after stimulation are expressed as n-fold difference relative to the calibrator (unstimulated cells). Shown are the cytokine expression (IFN-γ; TNF-α; IL-10; IL-18) for each infected animal (V-25, V-38 and V-27) as well as controls (C-1, C-2). Grey bars represent results from P-8 stimulation, black bars represent SLA stimulation and open bars represent ConA stimulation. Standard deviations are indicated and range from 0.0001 to 0.300.