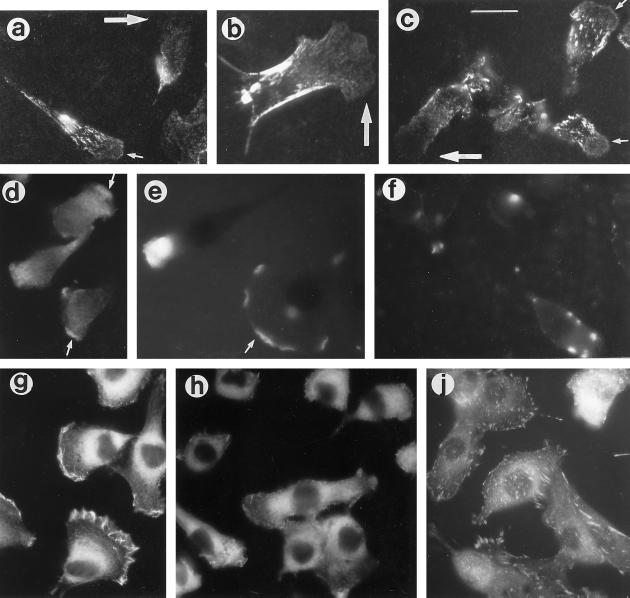
Figure 9.
Deposition of extracellular TSP and development of the motile phenotype in sparse cultures of C2C12 cells. Cells from control cultures (a–e and g) or cultures treated with 500 μg/ml heparin for 6 h (f, h, and j) were stained for fibronectin (a–c), TSP (d–f), fascin (g and h), or vinculin (j). Large arrows in a–c indicate cells with no detectable fibronectin at the leading edge; small arrows in a and c indicate examples of cells with some deposition of fibronectin in the lamellar region. Arrows in d and e indicate concentrations of TSP staining at leading edges. Bar, 9 μm.

