Figure 3.
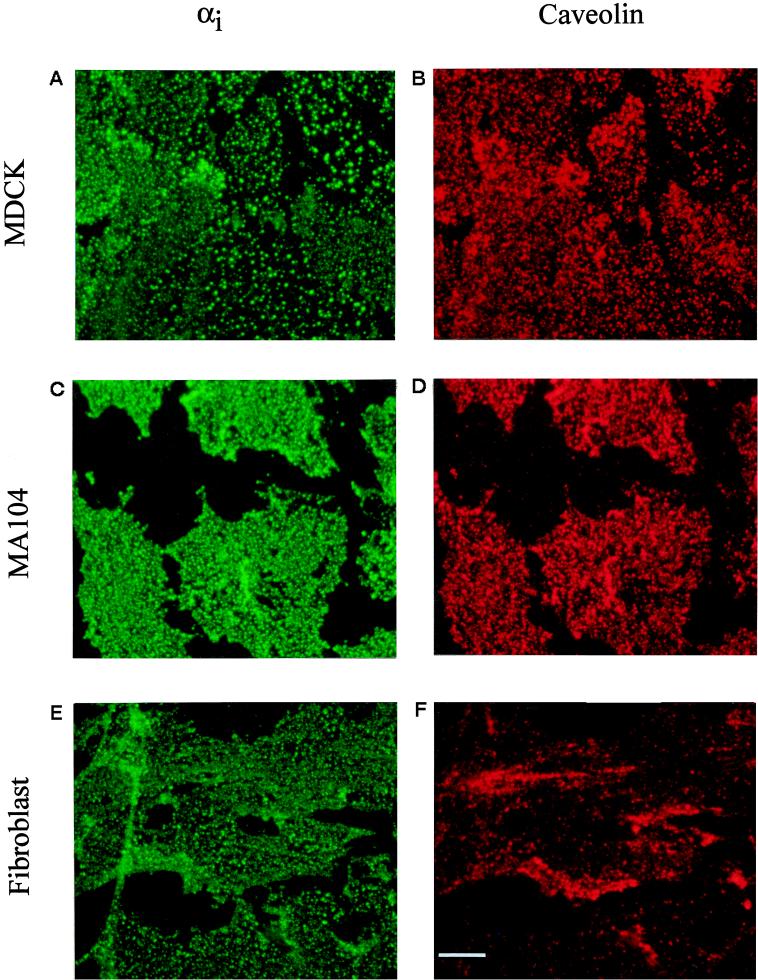
Double immunofluorescence of plasma membranes performed with antibodies specific for αi and caveolin. Plasma membranes similar to those in Figure 2 were prepared from MDCK cells (A and B), MA104 cells (C and D), and fibroblasts (E and F). Oregon green-conjugated secondary antibodies were used to visualize αi in the lefthand panels and Texas red-conjugated antibodies were used to detect caveolin in the righthand panels. The spillover of signal between the two fluorophores was insignificant (determined by single immunofluorescence, not shown). Affinity-purified B087 (10 μg/ml) was used for panels A and C, R4 (1:100 dilution of culture medium from antibody-producing cells) for panel E, caveolin monoclonal antibody (5 μg/ml) for B and D, and affinity-purified polyclonal antibody (10 μg/ml) for panel F. Scale bar, 4 μm.

