Figure 3.
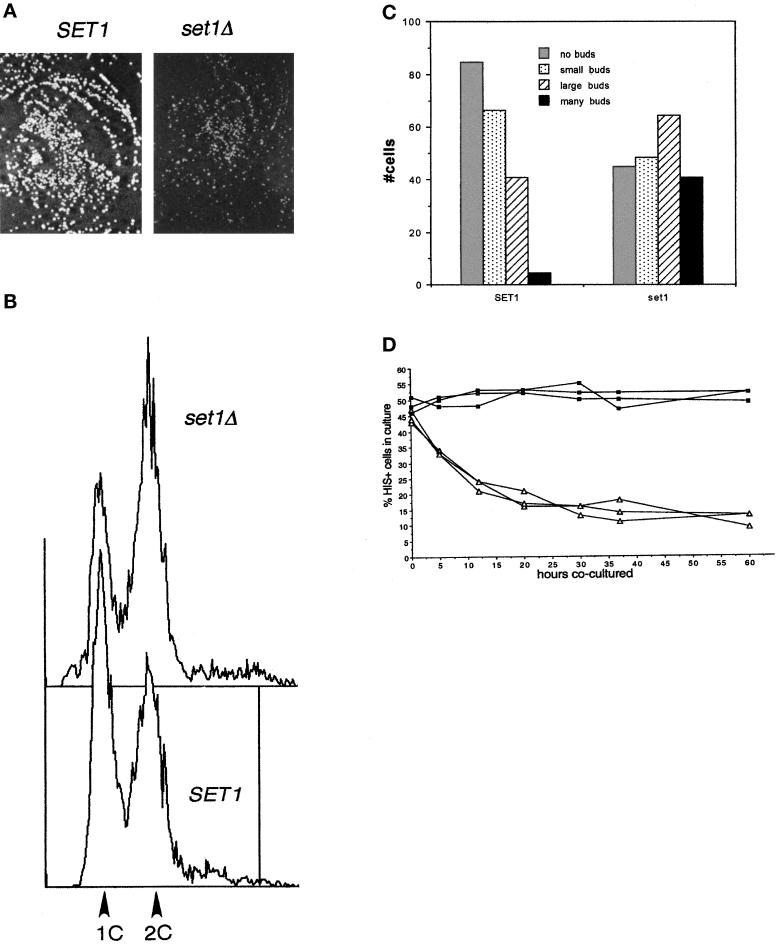
set1 mutants display a variety of growth defects. (A) set1 colonies (LPY1297, right) are smaller than wild-type (UCC1001, left) after 2–3 d at 30°C. This difference is no longer detected after 5–7 d of growth at 30°C. (B) Cell cycle analysis of the DNA content of asynchronous set1 cultures (LPY1297, top panel) shows a greater proportion of cells with 2C DNA content compared with wild-type SET1 cultures (UCC1001, bottom panel). (C) Budding index of set1 (LPY1297) mutants compared with wild-type (UCC1001) cells. Two hundred cells from three independent cultures were examined microscopically and categorized as: unbudded, small budded, large budded, or multi-budded. The number of cells in each category is indicated. (D) Coculture analysis of set1 mutants. Equal numbers of SET1 (UCC1001) and set1::HIS3 (LPY1297) cells (open triangles) were mixed, cultured at 30°C and plated at intervals onto YPD plates to determine the number of viable cells. These plates were replica-plated to his− medium to establish the fraction of cells that were His+. Control cocultures were inoculated with equal numbers of SET1 (UCC1001) and isogenic sir3::HIS3 (LPY2159) mutants (filled squares) and analyzed as above. Compared with the SET1-sir3 controls, set1 mutants are rapidly lost from culture.

