Figure 1.
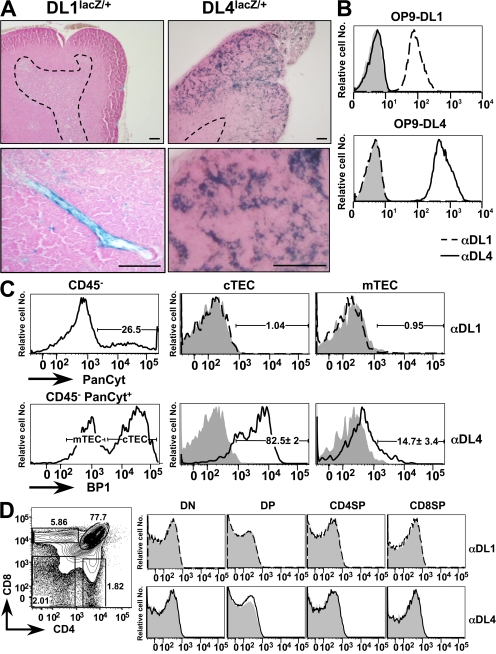
DL4 but not DL1 expression is detected on TECs. (A) LacZ staining on thymic sections derived from DL1 and DL4 lacZ knock-in mice. mRNA expression of the DL1-driven lacZ gene is confined to blood vessels within the thymus, whereas DL4 drives expression preferentially within the cortical epithelium. The dashed lines indicate cortical–medullary boundaries. Bars, 100 μm. (B) Anti-DL1 and -DL4 antibodies specifically bind their corresponding ligands without exhibiting cross-reactivity; OP-9–DL1–EGFP (top) and OP-9–DL4–EGFP (bottom) were stained with isotype Ctrl (shaded), anti-DL1 (dashed line), or anti-DL4 antibodies (continuous line; dilution, 1:100). The analysis was performed on gated EGFP-positive cells, and representative histograms are shown. (C) Anti-DL1 and -DL4 antibody staining on TECs. Enriched TECs extracted from wild-type thymi were stained for BP1 (3C6), CD45, and isotype Ctrl, anti-DL1, or anti-DL4 antibodies, followed by intracellular staining for PanCyt (C11) and flow cytometric analysis. Total TECs were gated as PanCyt+CD45− (top left), and cTECs and mTECs were further defined as BP1+ and BP1−, respectively (bottom left); isotype Ctrl (shaded), anti-DL1 (dashed line; top right), and anti-DL4 (continuous line; bottom right) are shown. Percentages of DL4+ TECs represent the mean ± SD of five mice. (D) DL1 and DL4 are not detectably expressed on thymocytes. (left) A representative flow cytometric analysis of CD4 versus CD8 of wild-type thymocytes. (right) DL1 and DL4 expression are shown as representative histograms (shaded, isotype Ctrl; dashed line, DL1; continuous line, DL4) after gating on the indicated thymic subpopulations: DN (Lin−, CD45+, CD4−, CD8−), DP (Lin−, CD45+, CD4+, CD8+), CD4SP (Lin−, CD45+, CD4+, CD8−), and CD8SP (Lin−, CD45+, CD4−, CD8+) thymocytes. Percentages of individual thymic subpopulations are indicated within the plots. Data are representative of three independent experiments.

