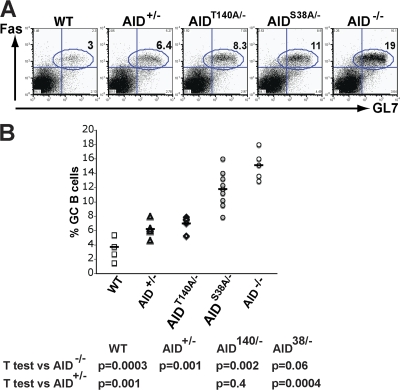
Figure 5.
Percentage of GC B cells from AIDS38A and AIDT140A mice. (A) Representative FACS analysis that shows percentage of FAS+GL7+ GC B cells in AID−/−, AID+/−, AIDT140A/−, AIDS38A/−, and wild-type (WT) mice 10 d after immunization. (B) Percentage of GC B cells in the lymph nodes of AID−/−, AID+/−, AIDT140A/−, AIDS38A/−, and WT mice 10 d after immunization from 6–8 mice. Each point represents an immunization experiment from a single mouse.

