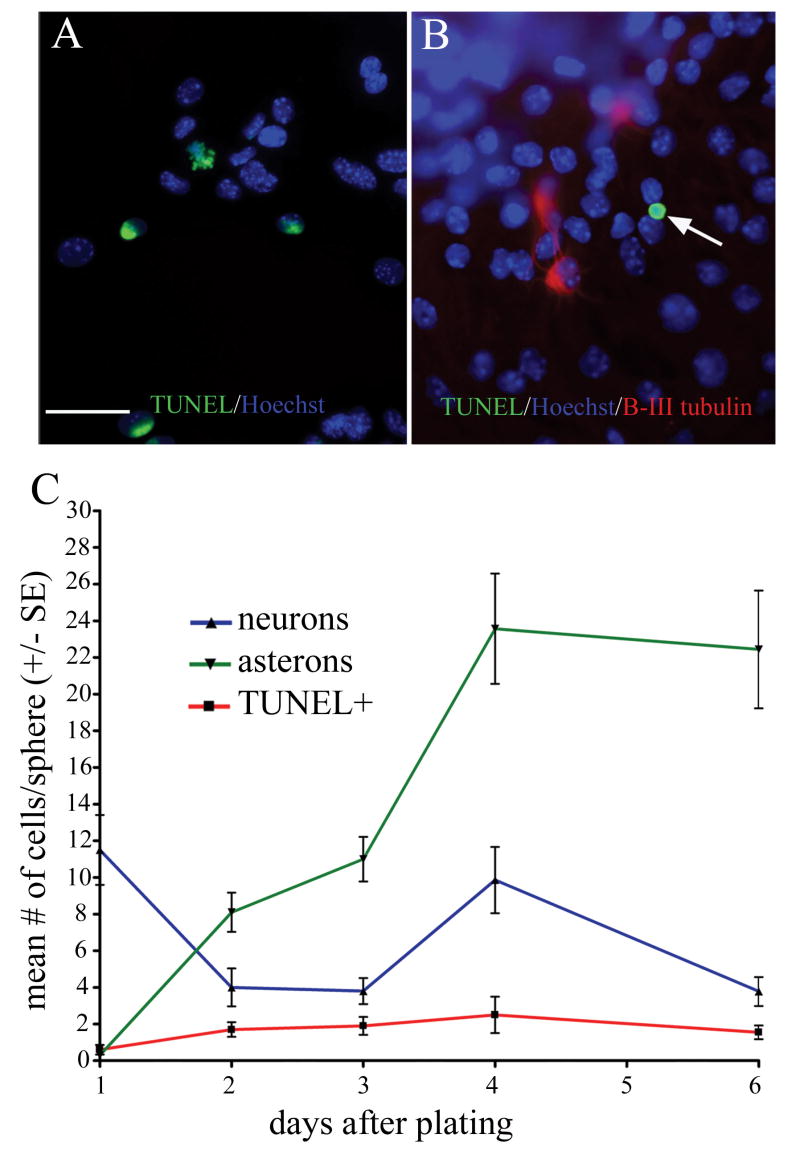
Figure 4. Asteron appearance corresponds with neuronal reduction that is not attributable to apoptotic cell loss.
TUNEL reveals apoptotic cells in control DNAse-treated sphere (green label in A). In untreated sphere cells plated for three days (B), TUNEL reveals a single dying cell (arrow) that is negative for β-III tubulin immunostaining (red). Graph in (C) shows the temporal relationship among neurons, asterons, and apoptotic cells. As neurons (blue line) decrease, there is a corresponding increase in asterons (green line). TUNEL (red line) shows that there is a steady rate of 1-3 apoptotic cells per sphere during the first week after plating. Scale bar = 40 uM.

