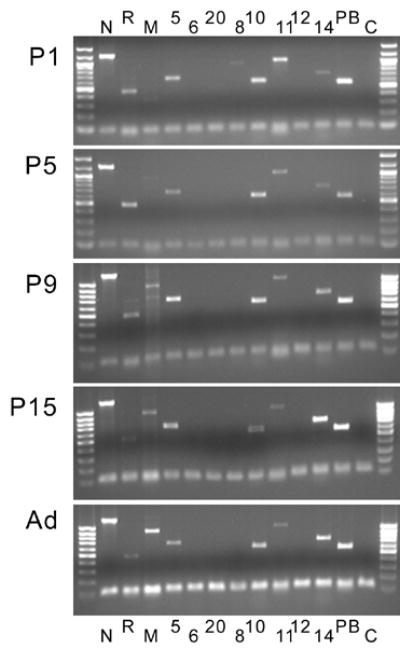
Figure 1.

Developmental expression of mRNAs for selected cadherins in the cerebellum (postnatal days 1 (P1) to 15 (P15) and adults (Ad)). The lower band corresponds to HGPRT, which was used to monitor loading efficiency. Cadherins are indicated by their respective letters or numbers; C indicates the control lane (no cadherin primers added). Note that multiple cadherins are expressed in the cerebellar anlage. No signal was detected for cadherins-6, -12 and –20. The age-related increase in M-cadherin signal reflects the developmental up-regulation of this gene described before (Bahjaoui-Bouhaddi et al., 1997).
