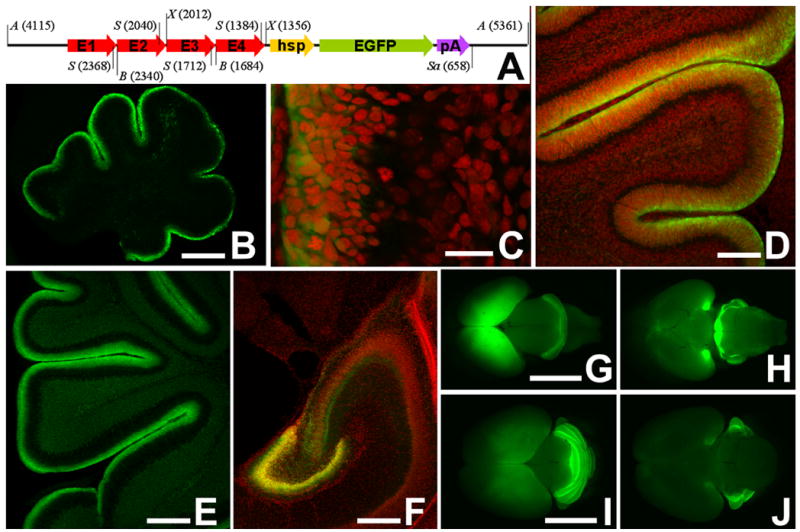
Figure 2. Expression of Math1-EGFP in the newborn mouse brain.

(A) Schematic diagram of the construct used to generate Math1-EGFP mice. Arrows E1 – E4 symbolize the four copies of the Math1 enhancer element B connected in series. hsp, minimal heat shock promoter; pA, pIND vector-derived polyadenylation signal. Selected restriction sites are labeled as follows: A, ApaL1; B, BlnI; S, SmaI; Sa, SacI; X, XhoI. Numerals in brackets refer to nucleotide positions relative to the origin of replication of the pBluescript base vector. Not drawn to scale.
(B) Midsagittal section through the cerebellum of a newborn (P0) Math1-EGFP transgenic mouse. EGFP-signal is confined to the external granule cell layer at the cerebellar surface.
(C) In this high power view of the cerebellum of a newborn mouse, it is evident that EGFP expression is particularly high in the outer part of the EGL (left side of the micrograph), and decreases with ongoing granule cell differentiation. Nuclei are counterstained in red with propidium iodide.
(D, E) The developmental decrease of EGFP in postmitotic and postmigratory granule cells is also evident in older animals at P3 (D) and P9 (E).
(F) Expression of Math1-EGFP in the hippocampal formation at P5.
(G–J) Whole-mount views of the newborn (P0; G, H) and P6 day old (I, J) mice seen from dorsal (G, I) and ventral (H, J). Besides cerebellar expression, expression in the hippocampal anlage (visibly fluorescent through the covering cortical anlage) and in pontine nuclei (G) is prominent at P0. Note that pontine nuclei are no longer marked at P6. Bar = 50 μm in B, E and F; 5 μm in C; 25 μm in D; 1 mm in G (for G, H); and 0.5 mm in I (for I, J).
