
Figure 4.
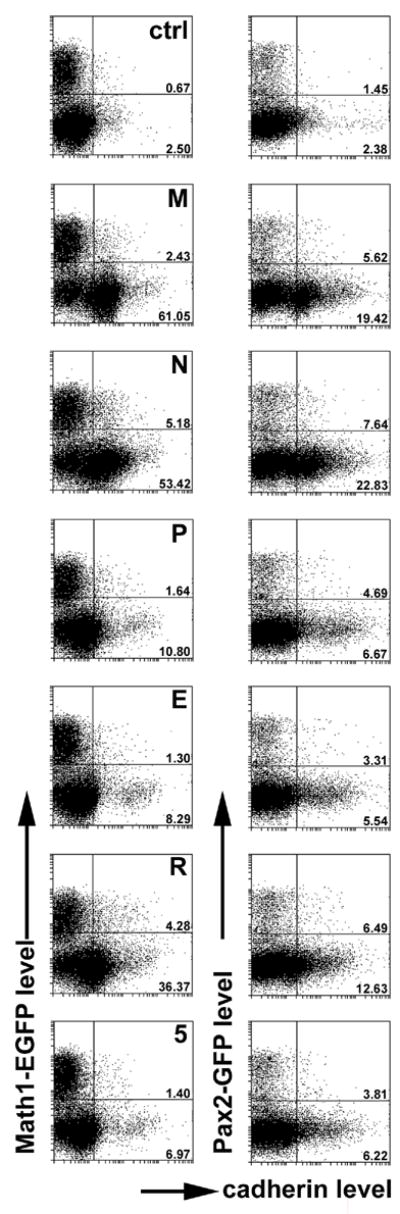
Flow cytometric analysis of cadherin expression in cerebellar cells derived from 8 day old mice expressing GFP under control of either the Math1 (left hand column) or Pax2 promoter (right hand column). We used cells incubated with secondary antibodies only (top panels; ctrl) to set up the cutoff levels for cadherin staining such that a maximum of 2.5% cells would be (erroneously) classified as positive. The cutoff between (E)GFP positive and negative cells was set based on the analysis of (E)GFP histograms. Numbers indicate the percentage of cells classified as immunopositive, separately for (E)GFP-positive and negative subsets. Particularly prominent is the expression of M-, N and R-cadherin in the Math1-negative subset of cells. For details, see text.