Figure 5.

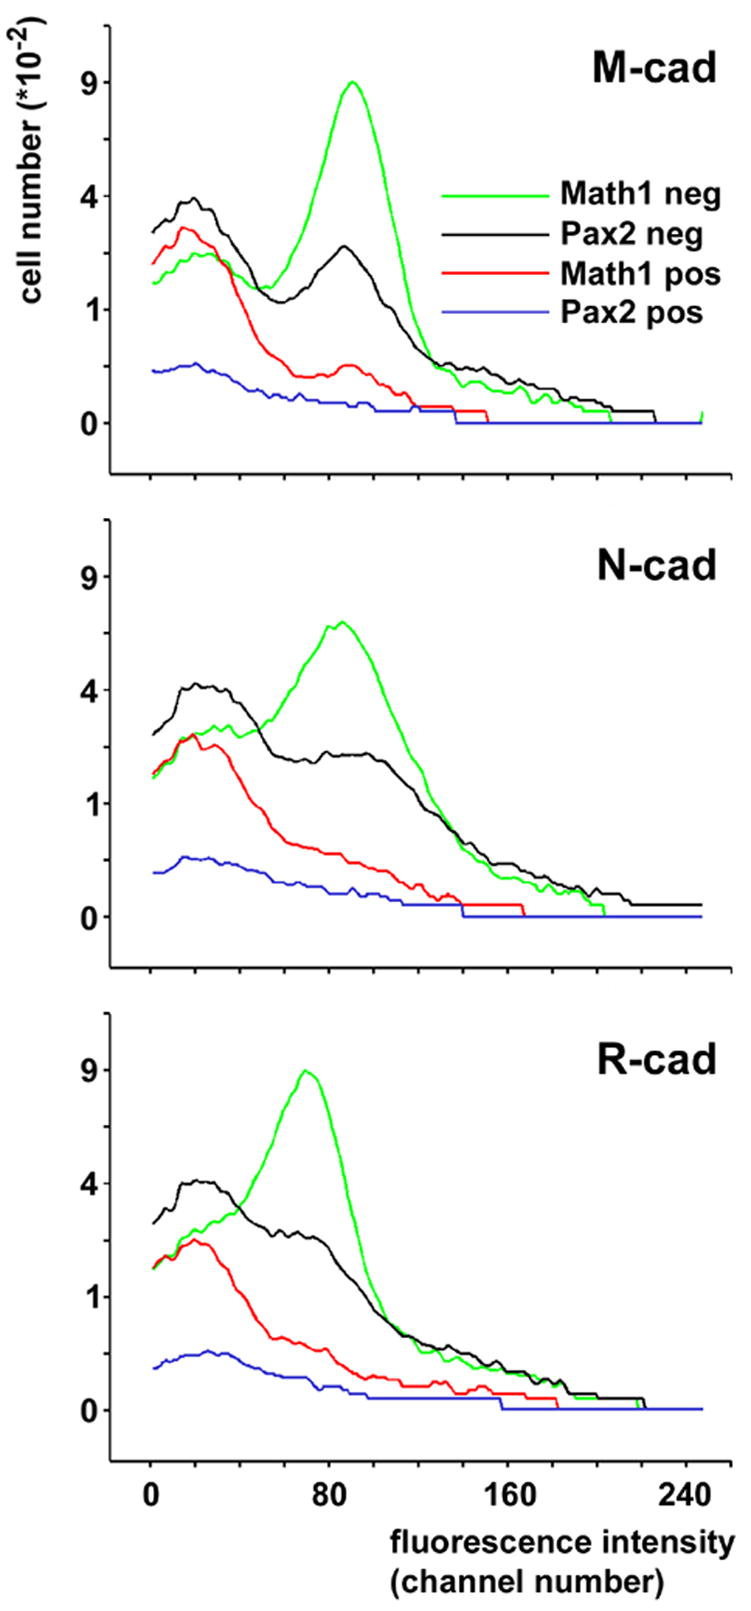
Comparison of immunoreactivity for M-, N and R-cadherin in cells classified according to their levels of Math1-EGFP expression or their levels of Pax2-GFP expression. Consistent with figure 3A–D, comparison of the curves describing Math1-EGFP-positive (green curve) and –negative cells (red curve) reveal the much higher level of immunoreactivity in the latter population. Most Pax2-GFP-positive cells (blue curve) show a level of cadherin immuno-reactivity comparable to that of Math1-EGFP positive cells. The bimodal distribution of Pax2-GFP-negative cells (black curve), which quantitatively comprises immature and maturing granule cells, closely reflects the distribution of Math1-EGFP-positive and -negative cells.
