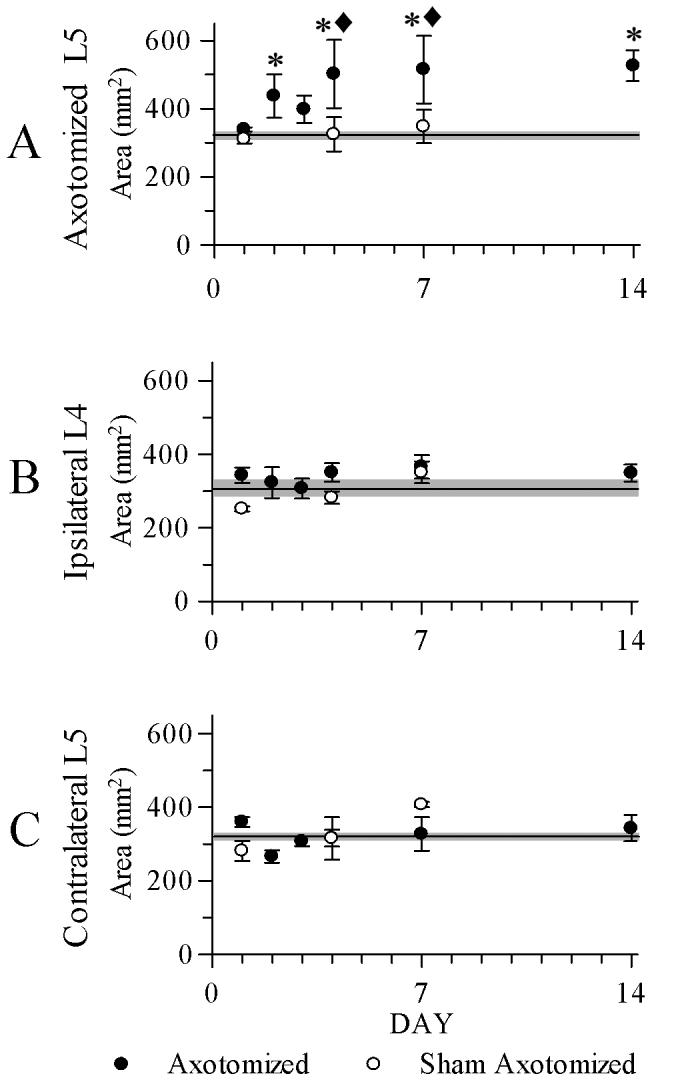
Figure 2.

A plot of mean areas of SP - positive dorsal root ganglion neurons showing changes following axotomy. Unoperated control means are indicated in all graphs by a horizontal line, with gray shaded zones indicating the SEM of these means. A. Neuron size was significantly increased in axotomized L5 ganglia at 2, 4, 7, and 14 days postoperatively (dpo), compared to control (*) and to day-matched 4 dpo and 7 dpo sham ganglia (◆). B, C. There were no significant differences with similar comparisons of the ipsilateral L4 or contralateral L5 ganglia. N = 4 in all groups except n = 3 for ipsilateral L4 sham, 1 dpo. Error bars = SEM.
