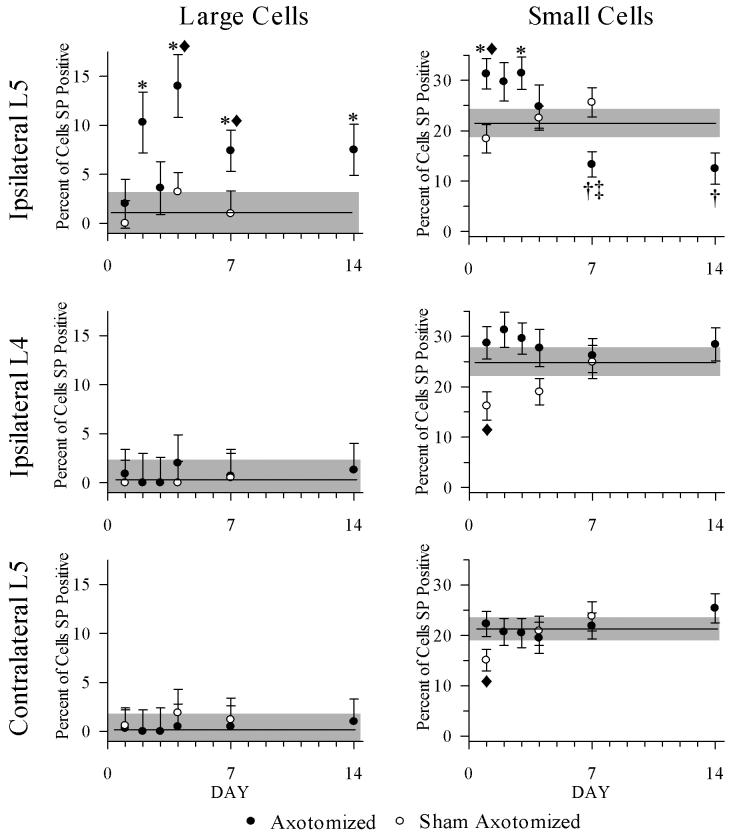
Figure 5.
Percentages of SP-positive neurons >800 μm2 (left column) and ≤ 800 μm2 (right column) graphed by day. Unoperated control means are indicated in all graphs by horizontal line, with gray shaded zones indicating the SEM of these means. Left column: for large neurons from L5, there were higher percentages of SP positive neurons >800 μm2 compared to control L5 ganglia at 2, 4, 7, and 14 dpo, (* = p < 0.05), and compared to sham ganglia at days 4 and 7 (◆ = p < 0.05). There were no changes in L4 or contralateral L5. Right column: for small neurons from L5, there were higher percentages of SP positive neurons ≤ 800 μm2 compared to intact ganglia at 1 and 3 dpo (* = p < 0.05) and compared to sham ganglia at day 1 (◆ = p < 0.05). At 7 and 14 dpo, the percentages of SP positive neurons were less than control (†) and at 7 dpo was less than the day matched sham ganglia (‡). Proportions from intact L4 and L5 ganglia were different from sham ganglia at 1 dpo (◆ = p < 0.05). Error bars = SEM.

