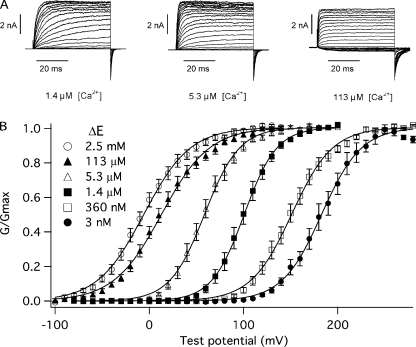
Figure 1.
Macroscopic currents and normalized conductance versus voltage curves (G-V) determined for the mSlo mutant E399N (ΔE). (A) Shown are averaged macroscopic current families. Each family displayed is the average of three consecutive families recorded from a single TSA 201 inside-out macropatch exposed to 1.4, 5.3, and 113 μM [Ca2+]. Membrane voltages were as follows: For 1.4 μM [Ca2+] and 5.3 μM [Ca2+], VH was −80 mV, test potentials were to between −80 and +200 mV, and tail potentials were −80 mV; for 113 μM [Ca2+], VH was −150 mV, test potentials were to between −100 and +150 mV in 10-mV steps, and tail potentials were −80 mV. (B) G-V relations were determined from data like that in A at the following [Ca2+]: 0.003, 0.36, 1.4, 5.3, 113, and 2,500 μM. Each curve represents the average between 7 and 13 individual curves. Error bars indicate SEM. The data have been fitted (solid lines) with a Boltzmann function (G/Gmax = 1/(1+e q-F(V-V1/2)/RT). The Boltzmann fits have the following parameters: 3 nM Ca2+: Q = 1.21 e, V1/2 = 183 mV; 360 nM Ca2+: Q = 1.18 e, V1/2 = 151 mV; 1.4 μM Ca2+: Q = 1.47 e, V1/2 = 101 mV; 5.3 μM Ca2+: Q = 1.38 e, V1/2 = 59 mV; 113 μM Ca2+: Q = 1.00 e, V1/2 = 13 mV; 2.5 mM Ca2+: Q = 1.04 e, V1/2 = −5.7 mV.

